

Today’s newsletter is sponsored by Xplor Pay. Launching embedded payments is one thing. Building a program that drives merchant adoption, revenue growth, and long-term enterprise value is another. Xplor Pay’s Investor-Operator Guide to Embedded Payments examines why payments programs often underperform after launch and what high-performing vertical SaaS companies do differently.

Drawing on firsthand experience building and scaling more than 20 vertical SaaS platforms, the guide offers practical insights for founders, operators, and investors looking to maximize the value of embedded payments. Download the free guide. Heading to the Vertical Software Summit, November 4–5? Xplor Pay will be there. Let’s talk about how to get more value from your embedded payments program.
We wrapped the Vertical Software Summit and it was INCREDIBLE.
400+ founders/operators/investors in the room together.
Wow. If you came out for it thanks for being there.
You’re the reason I write this every week :-)
At the event I presented the 2026 State of Vertical Software & Vertical AI Report which included data from 126 founders across all stages. Thank you to all the founders who filled it out, VC’s who shared it with their portfolios, it is because of you we all can benefit / learn from / level up with this much data!
I’m dropping it below for your reading pleasure…

The State of Vertical Software & Vertical AI
I can only fit so much in an email so encourage you to
review it on the web by clicking below:
Two clocks. One milestone.
Procore took fourteen years to reach Estimated $100M ARR.
Legora took eighteen months.
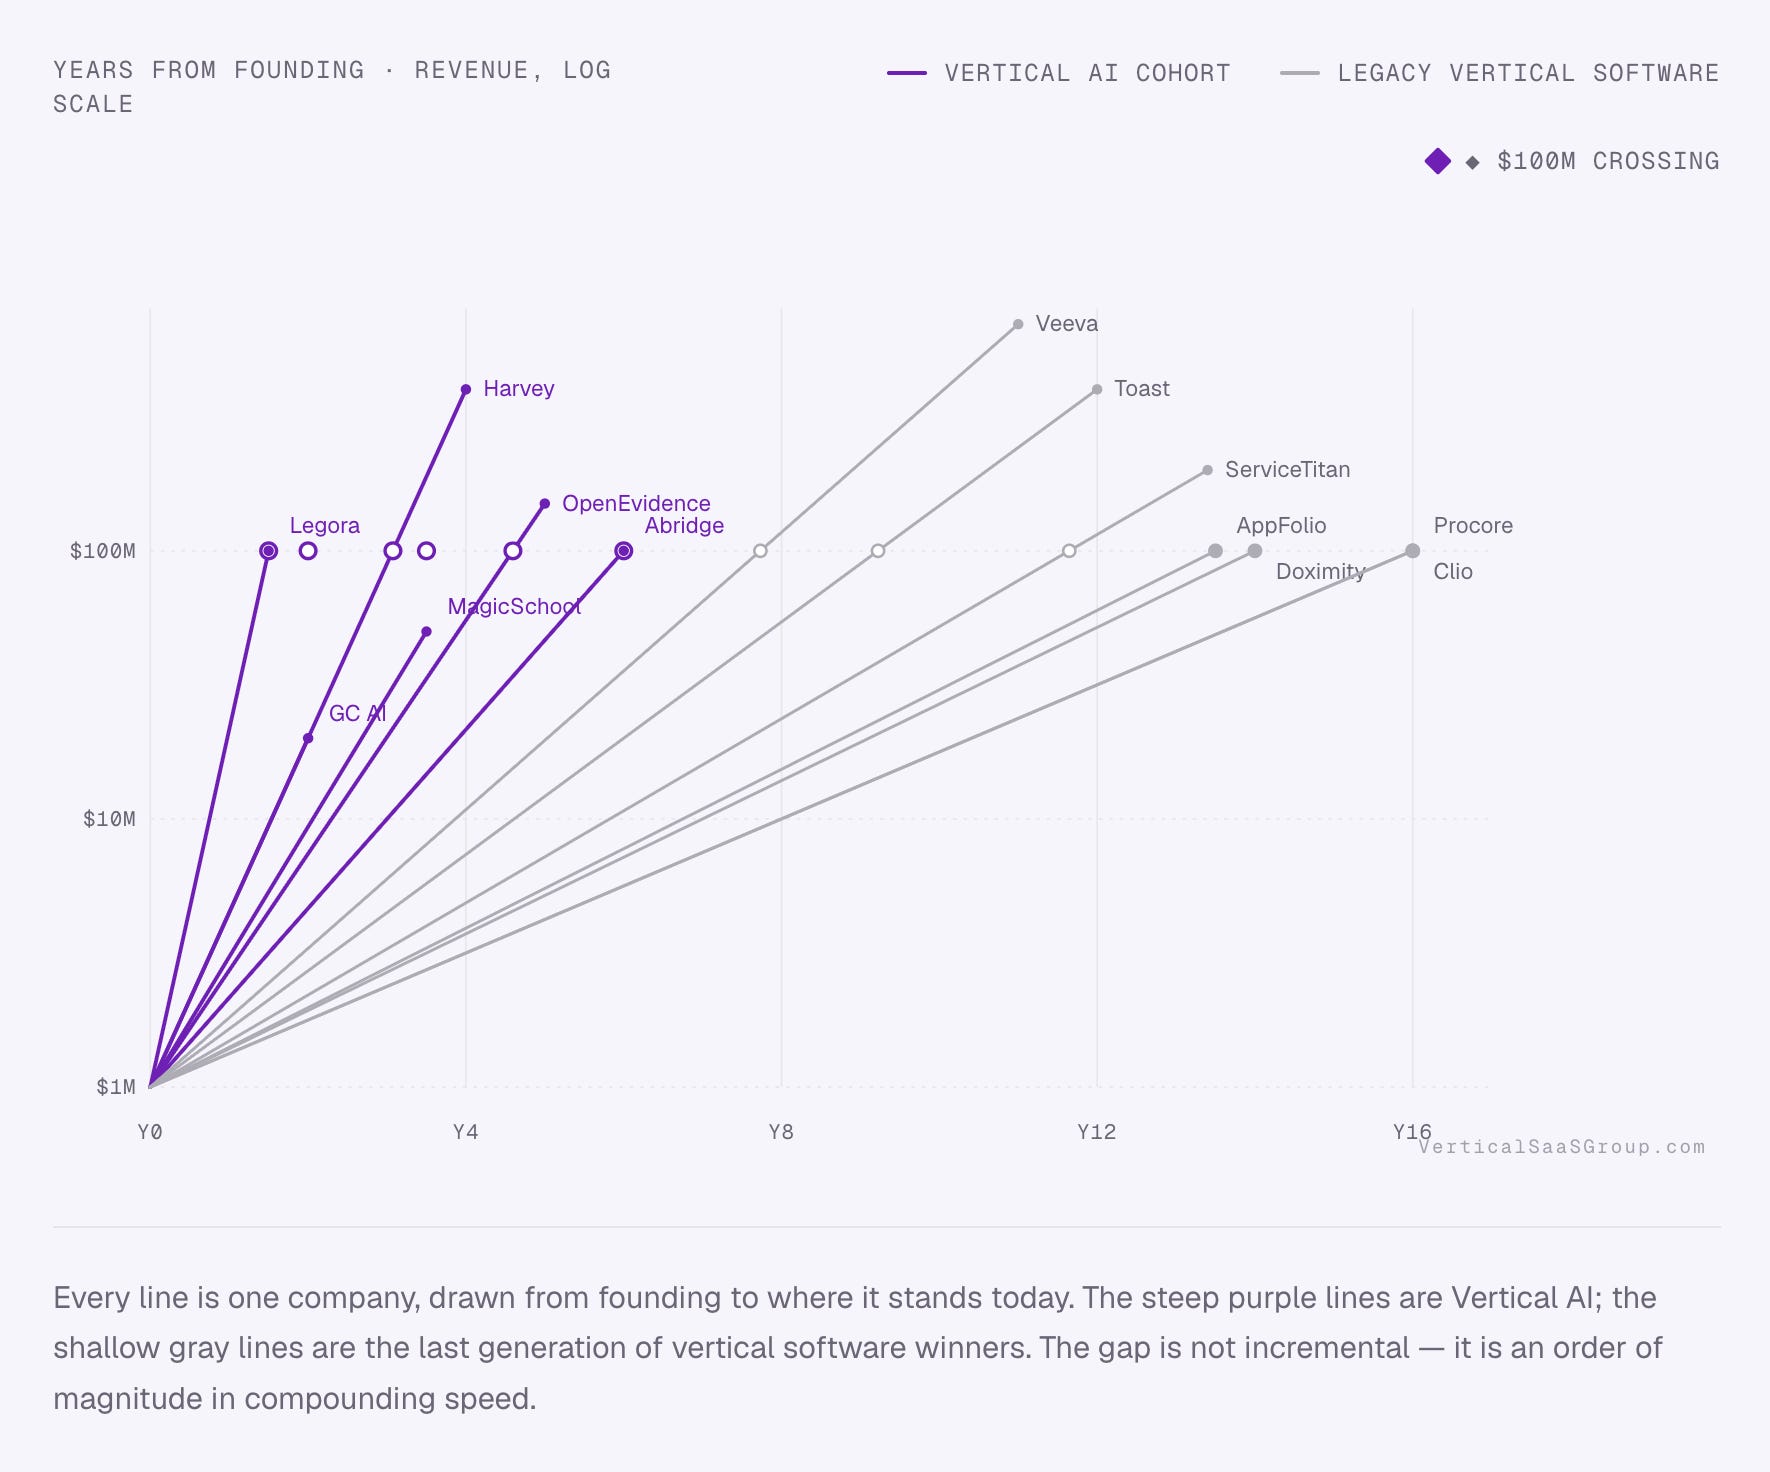
Four of the six Vertical AI companies in this cohort crossed Estimated $100M ARR in under six years. Legora did it in eighteen months — faster than Wiz, faster than Deel — and OpenEvidence moved from zero to Estimated $150M in revenue in about a year, with 300,000 doctors on the platform. Doximity, the closest thing that industry had to a fast winner, needed a decade.
The legacy cohort is not a group of slow failures. Veeva, Toast, ServiceTitan and Procore are the defining companies of the last vertical generation, and every one of them ground through a decade or more before the same milestone. That grind was structural: enterprise sales cycles, onboarding services, integrations built one customer at a time. Vertical AI dissolves most of that — the product reaches competency without a decade of edge-case accumulation, and distribution compounds through the model itself.
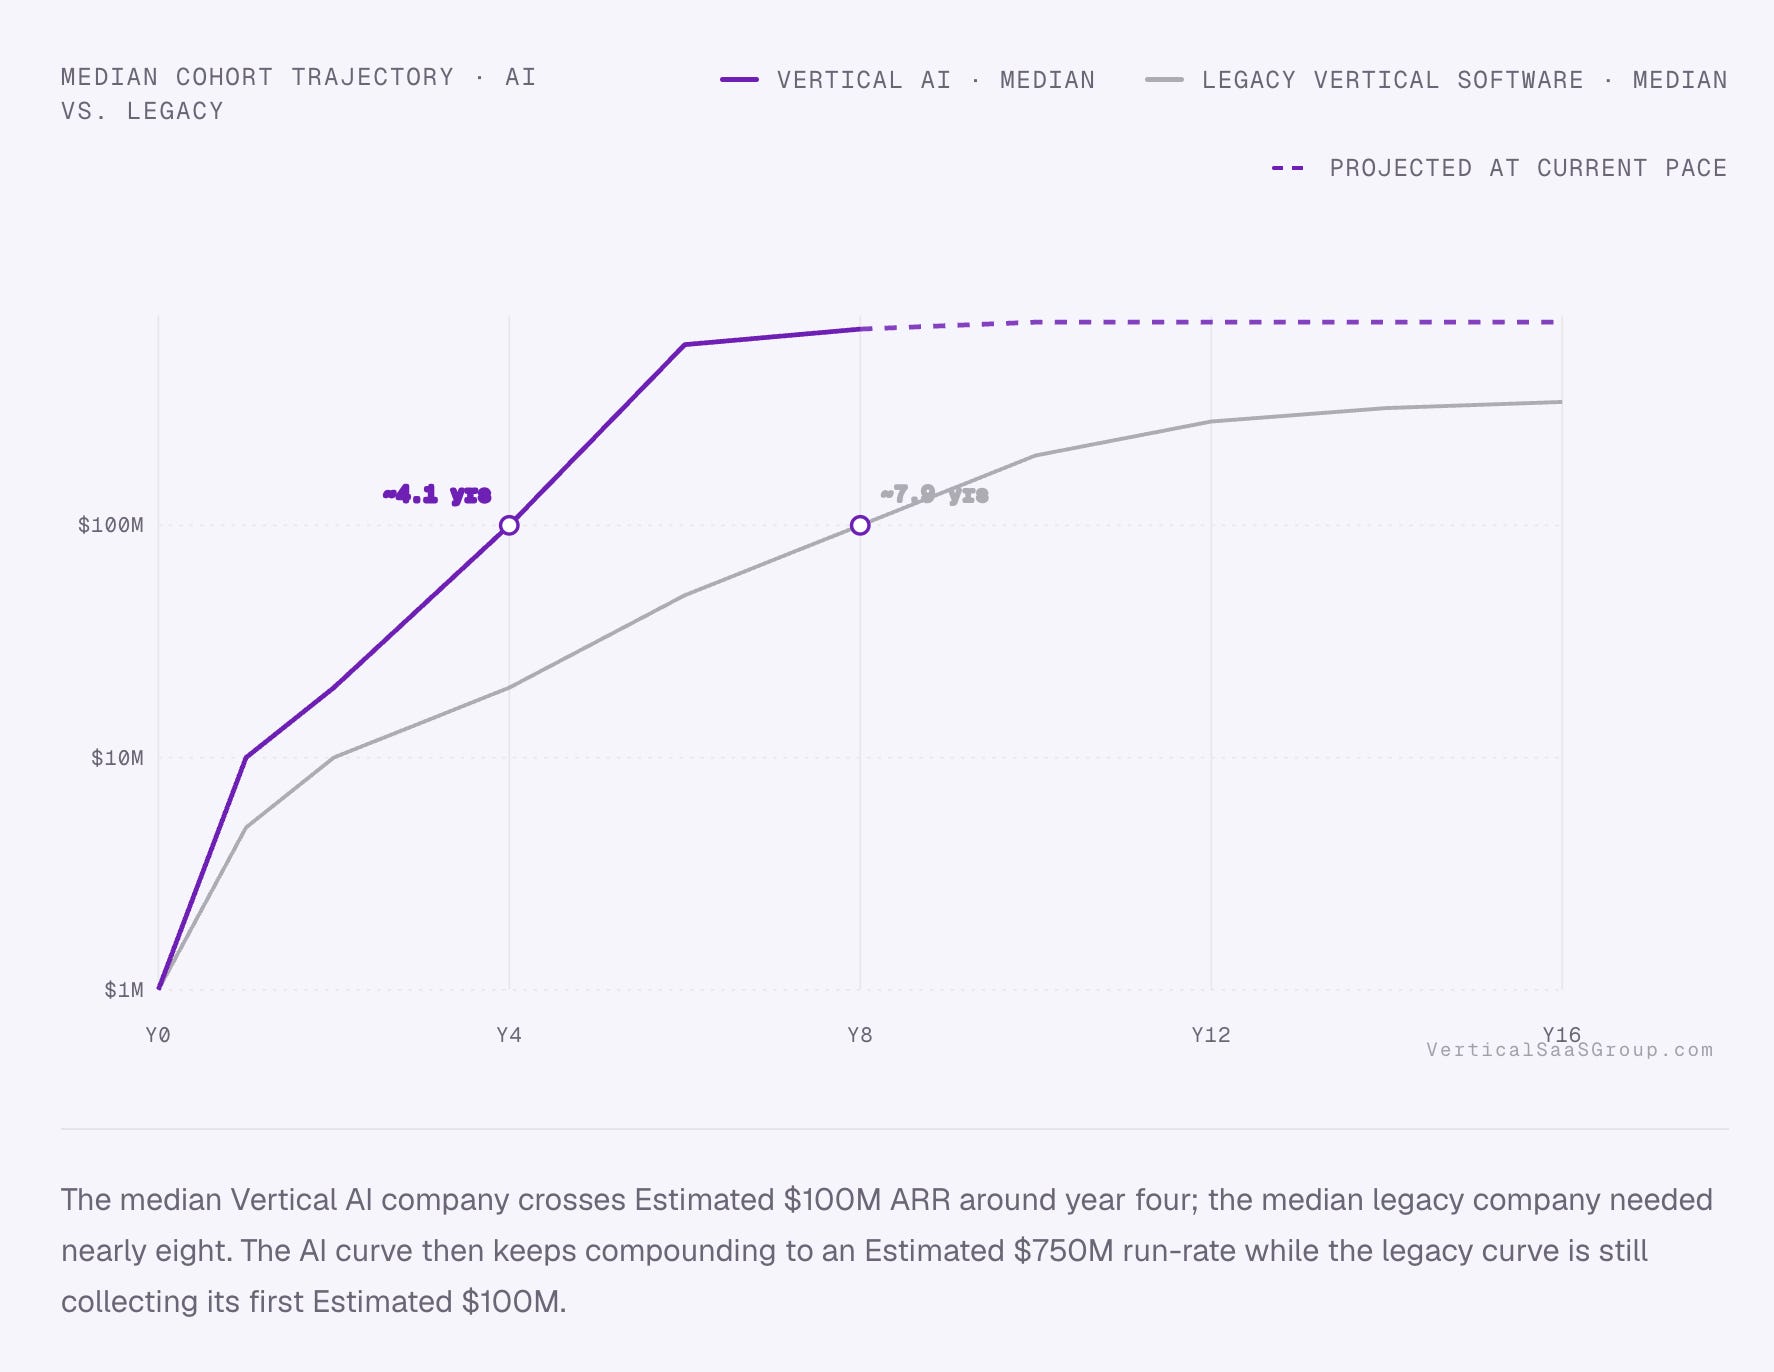
Read the median chart the way an investor would. The two curves start at the same place — one founder, one product, one market. By year four they have separated by 5×, and by year eight by 7×. If even part of that separation holds, capital allocated to vertical markets over the next five years will flow to a different set of companies than it did over the last ten.
The honest caveat: the AI cohort is young, self-reported, and pre-COGS. The legacy medians are measured against audited, mature financials. Treat the slope, not the absolute levels, as the finding — and the slope says the cost of reaching scale in a vertical has collapsed.
Median Vertical AI: ~4.1 yrs
Median Legacy Vertical Software: ~7.9 yrs
The last generation of vertical winners needed a decade to do what this generation is doing in thirty-six months.
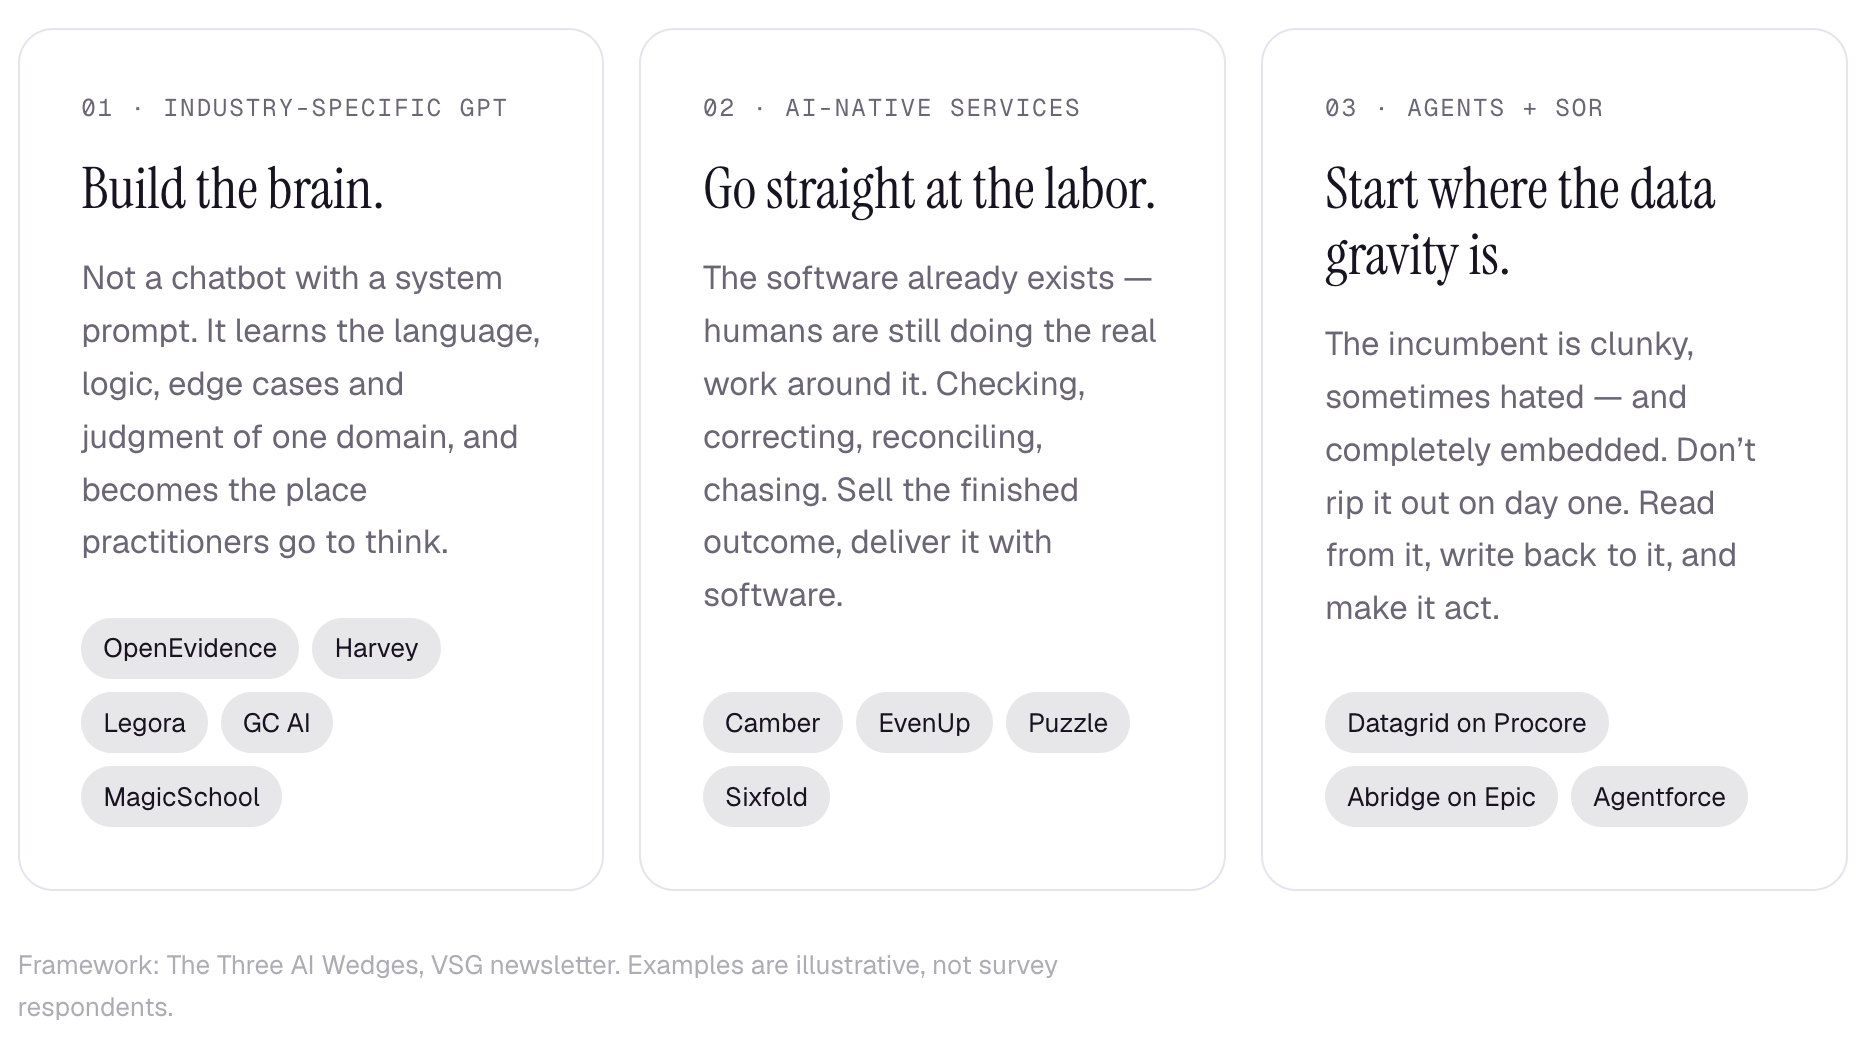
Three wedges. Not three features.
The strongest companies are not adding AI to a menu. They are choosing where to enter the market and what work to own.
Which best describes your AI strategy today?
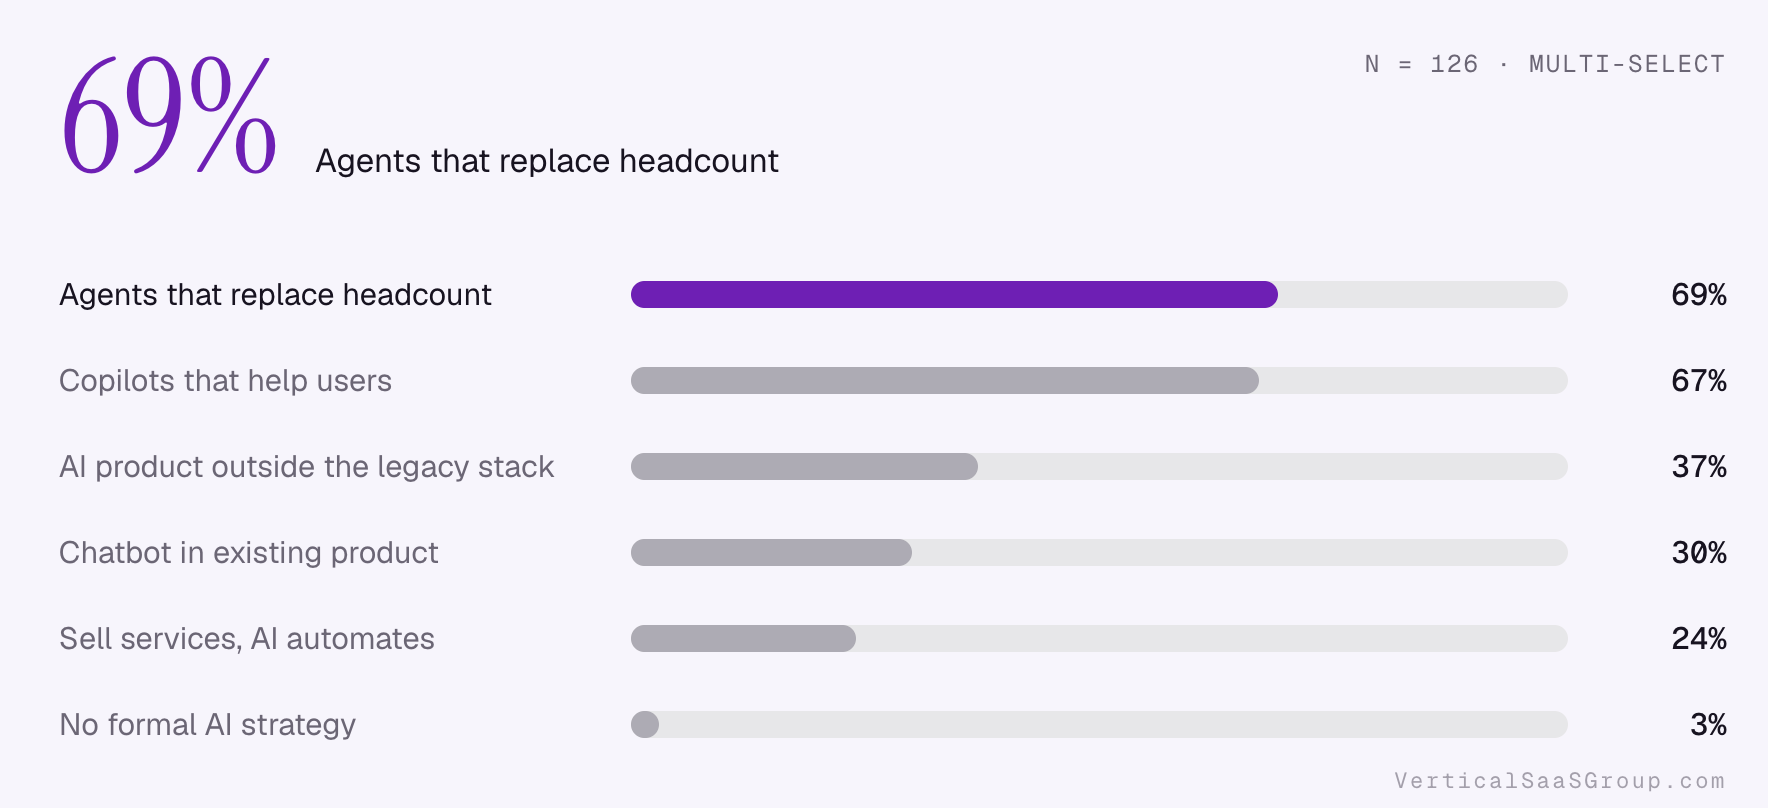
Agents and copilots lead the strategy mix, but they are not mutually exclusive bets. A platform can assist its users in one workflow and replace manual execution in another. The strategic question is not whether to add a chat surface. It is which job your platform can reliably finish.
The near-equal selection of headcount-replacing agents at 69% and user-assisting copilots at 67% points to parallel ambitions rather than a clean succession from one product category to another. Because respondents could choose multiple answers, the evidence does not tell us how many companies pursue both. The useful distinction is the obligation each product assumes: assistance improves a person’s decision; execution takes responsibility for completing a job.
That distinction changes the operating mandate. An execution product needs explicit permissions, a definition of success, and a recovery path when the work cannot be completed. A copilot can be valuable without owning those obligations. Leaders should allocate investment by workflow readiness, not by the ambition of an agent label. The scarce capability may be the ability to handle exceptions in a specific industry, rather than access to a stronger model.
What to do about it:
Choose a bounded, high-frequency workflow. Define the completed outcome, the exception path, and the human approval boundary before choosing the interface.
Which customer job will the platform own end to end?
Where must a human retain decision authority?
What evidence demonstrates successful execution rather than assistance?
How much of your product runs on agents?
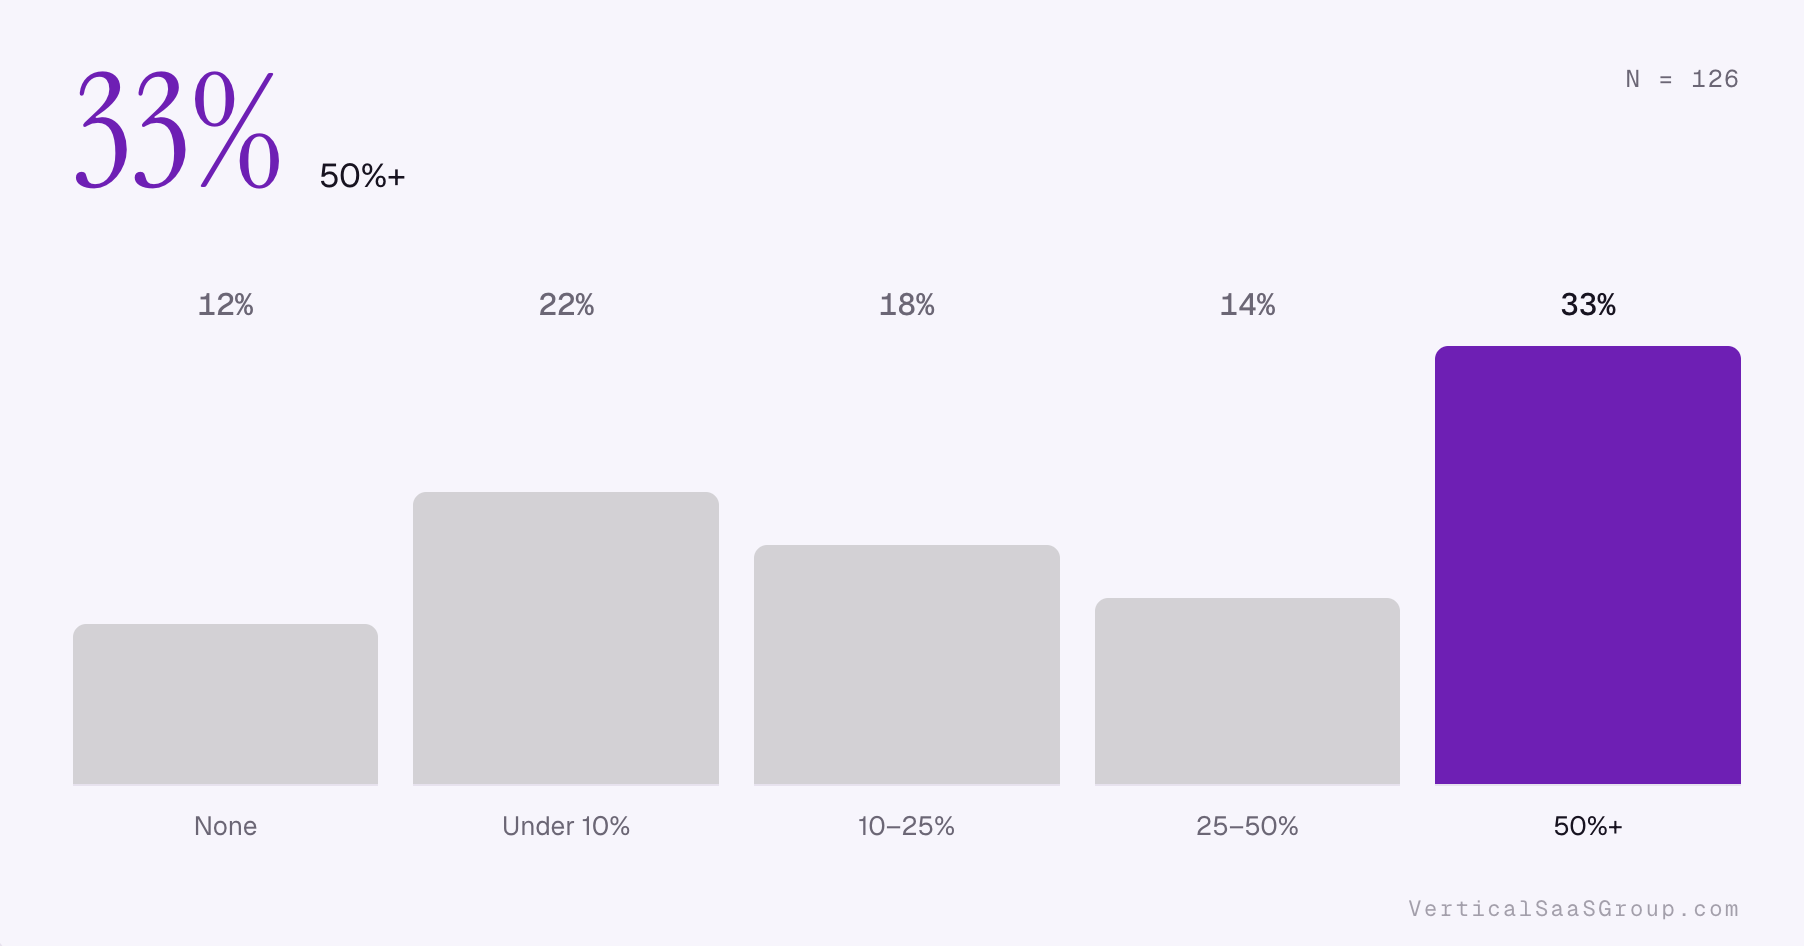
The largest response bucket is the most automated one. Yet the unautomated and lightly automated groups remain substantial. This is a market moving at different speeds, not a uniform wave. An agent-first competitor may be selling a fundamentally different operating model to the same customer.
The distribution spans the full adoption range: 12% report no agent-run workflows and 33% report coverage of at least half. A further 22% remain below 10% coverage. These groups are likely to require different product and operating choices, but the survey cannot tell us whether their differences reflect company age, customer appetite, or the complexity of the work being automated.
Counting workflows also gives a small administrative task the same apparent weight as a consequential transaction. A platform could automate many low-risk tasks while leaving its economic core untouched. Leadership reporting should therefore pair coverage with workflow materiality: customer hours consumed, the cost of failure, the volume of human interventions, and the share of work completed correctly. Increasing automation that creates more rework is not necessarily progress.
What to do about it:
Measure completed workflows, not AI feature clicks. Track exception rates and rework alongside execution volume so adoption does not conceal a quality problem.
Which workflows drive the most customer cost or delay?
What share finishes correctly without human rework?
Can an operator inspect, stop, and recover a failed action?
This is just a taste the FREE report has a sh*t load more of data you’ll want to see.
How has YoY growth changed since you added AI?
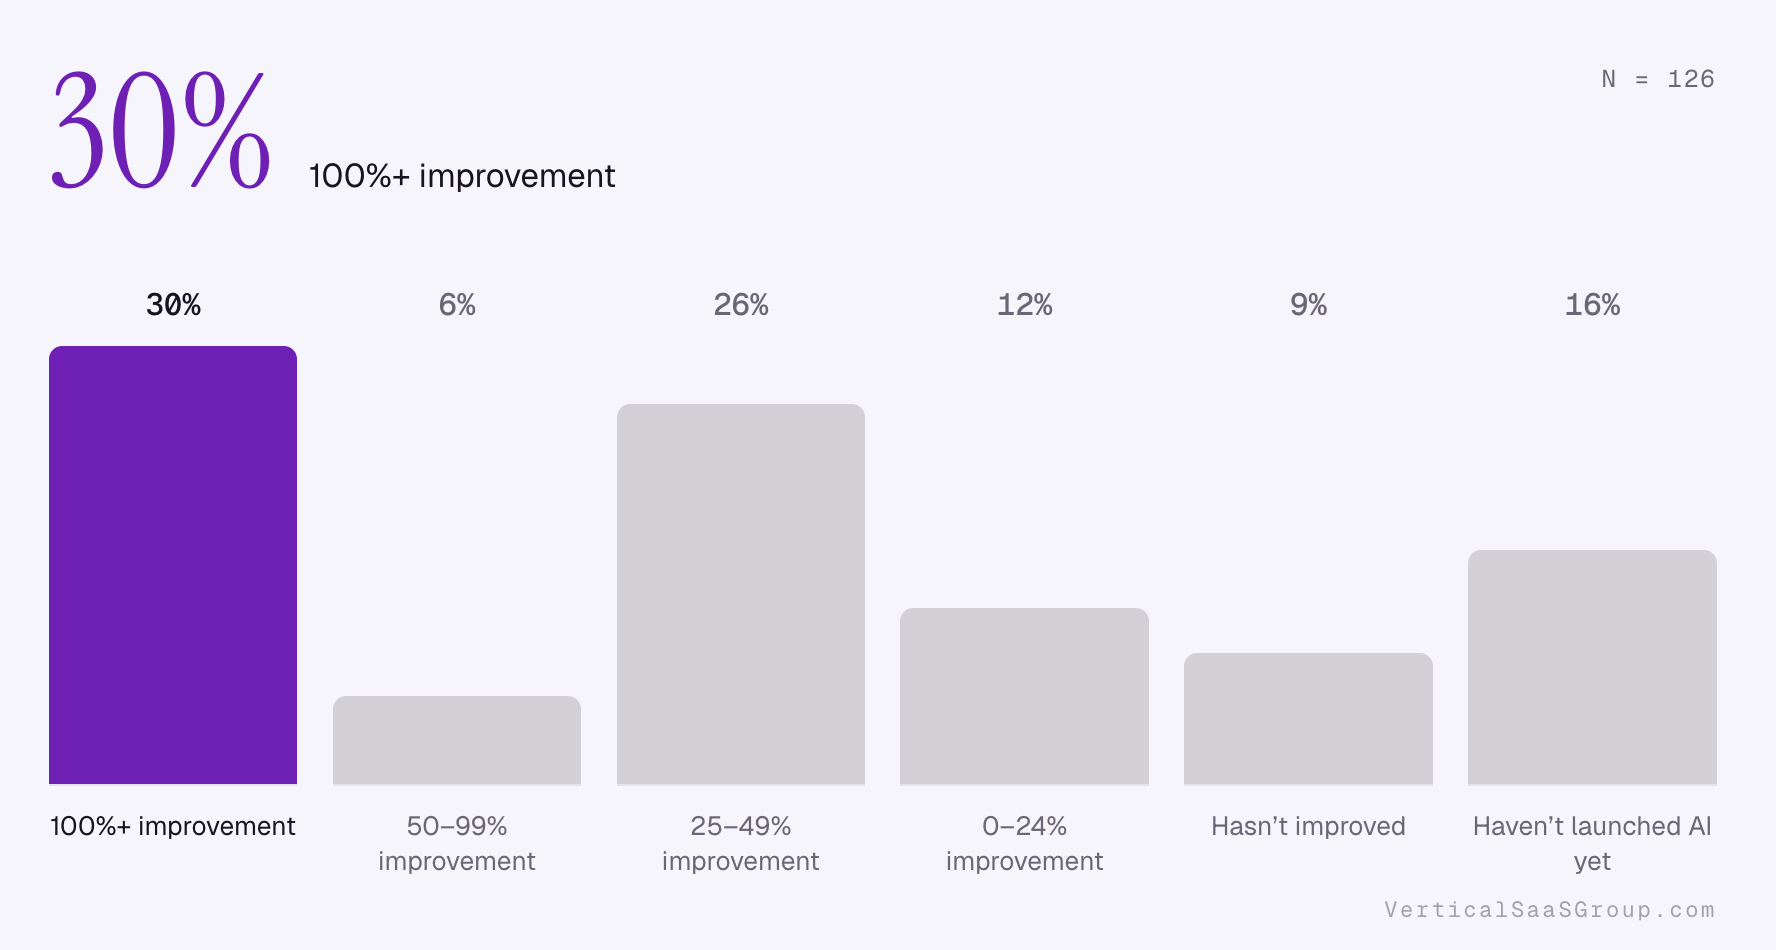
A sizeable group reports a step change in year-over-year growth after adding AI. Other operators report smaller improvements, no improvement, or no launch yet. The distribution argues against treating AI as a guaranteed growth multiplier. Product, distribution, and timing still determine who captures the opportunity.
Thirty percent report a growth improvement of at least 100%, while 26% report a 25–49% improvement. Those are meaningful reported changes, but a percentage improvement depends heavily on the starting growth rate and observation period. The results do not establish a common growth baseline, nor do they isolate AI from simultaneous changes in distribution, pricing, or market demand.
A disciplined planning process separates the mechanisms. AI could improve conversion, open a new customer segment, accelerate implementation, or support expansion. Each mechanism has different durability and resource requirements. Faster conversion may be repeatable; a launch-driven spike may not be. Treat the survey as a reason to investigate the commercial engine, not as a multiplier to apply to next year’s plan.
What to do about it:
Separate new customer growth, expansion, and price changes. Find the mechanism behind the improvement before extrapolating it into the next planning cycle.
Did growth come from new customers, expansion, or price changes?
What baseline and comparison period underpin the improvement?
Which leading indicators would support the same outcome next quarter?
How has median ACV changed since adding AI?
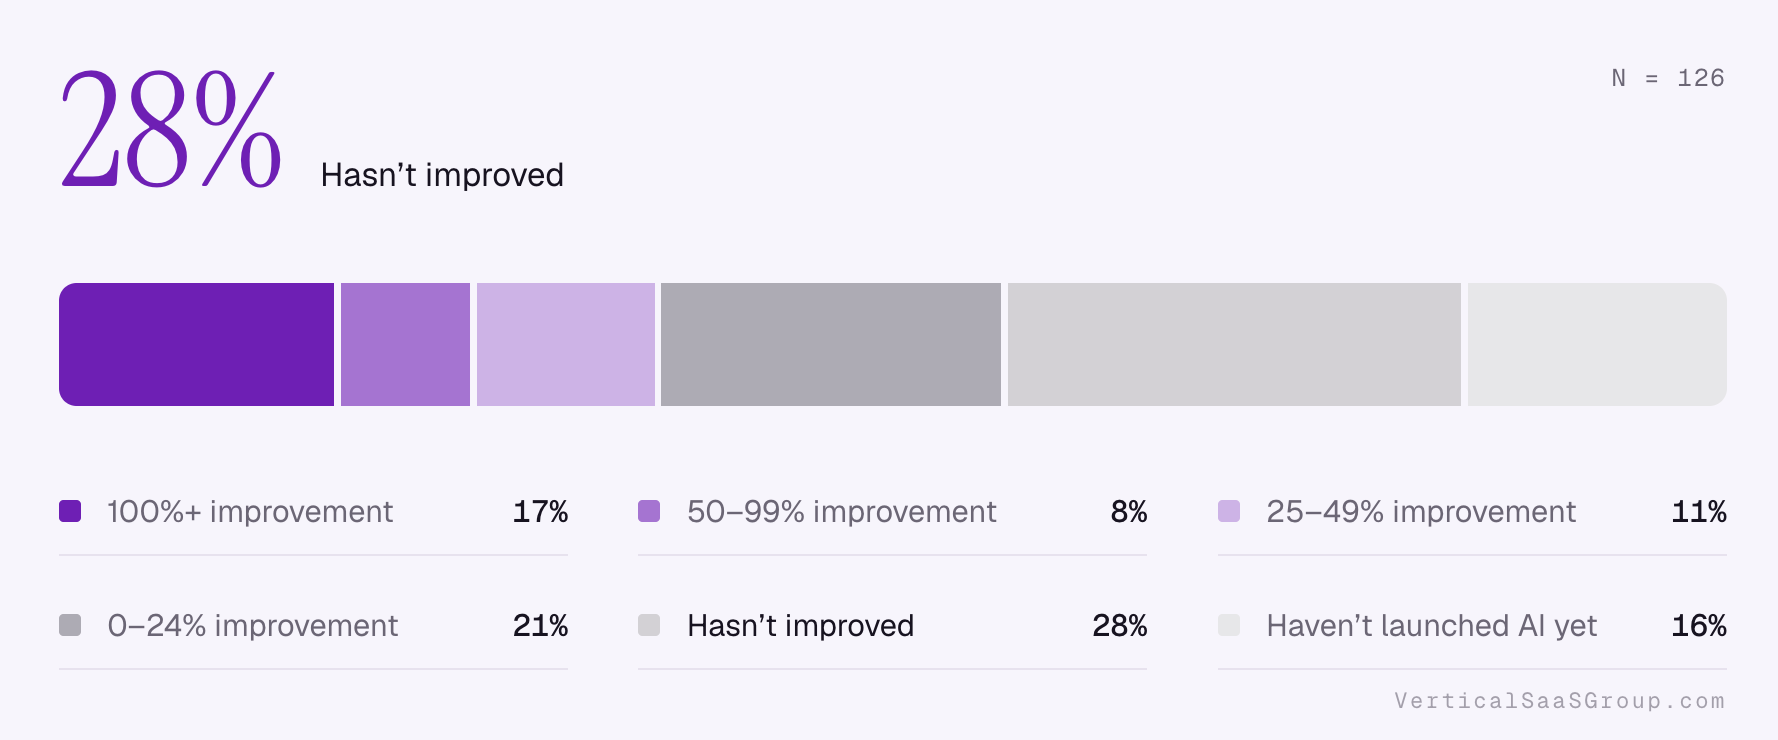
The largest ACV response is no improvement. Contrast that with the growth results: faster growth can coexist with limited contract expansion. AI may win new customers, improve conversion, or reduce delivery friction without changing what each customer pays.
No improvement is the largest ACV response at 28%; another 21% report improvement in the 0–24% band. By contrast, 30% of respondents to the growth question report an improvement of at least 100%. These are separate aggregate distributions, not a matched-company comparison. Nevertheless, they suggest a useful diagnostic: commercial momentum does not necessarily require a substantial increase in the median contract.
Contract value can lag capability when AI is bundled, when a customer has not yet renewed, or when the economic buyer cannot verify the promised benefit. Those are hypotheses, not findings from this survey. Test them within the same accounts by tracing deployment, realized outcomes, and renewal decisions. Segment the analysis by customer size and offer; an aggregate median may conceal expansion in one segment and a move downmarket in another.
What to do about it:
Make the value visible at renewal. Connect the commercial conversation to a completed business outcome, not a list of newly shipped capabilities.
Which segments show larger contracts, and which do not?
Is AI changing scope, price, or the customer mix?
What verified outcome would justify a larger renewal?
How has median ACV changed since adding AI?
The largest ACV response is no improvement. Contrast that with the growth results: faster growth can coexist with limited contract expansion. AI may win new customers, improve conversion, or reduce delivery friction without changing what each customer pays.
No improvement is the largest ACV response at 28%; another 21% report improvement in the 0–24% band. By contrast, 30% of respondents to the growth question report an improvement of at least 100%. These are separate aggregate distributions, not a matched-company comparison. Nevertheless, they suggest a useful diagnostic: commercial momentum does not necessarily require a substantial increase in the median contract.
Contract value can lag capability when AI is bundled, when a customer has not yet renewed, or when the economic buyer cannot verify the promised benefit. Those are hypotheses, not findings from this survey. Test them within the same accounts by tracing deployment, realized outcomes, and renewal decisions. Segment the analysis by customer size and offer; an aggregate median may conceal expansion in one segment and a move downmarket in another.
What to do about it:
Make the value visible at renewal. Connect the commercial conversation to a completed business outcome, not a list of newly shipped capabilities.
Which segments show larger contracts, and which do not?
Is AI changing scope, price, or the customer mix?
What verified outcome would justify a larger renewal?
That’s all I can fit in an email…
Access the FREE report at the button below :-)
Do me a solid and forward to a friend :-)
Great read. One thing I notice, having worked with SaaS team:
Most of the AI in vertical SaaS today is the vendor shipping the same agent to every customer.
But every customer runs their business a little differently, and that's where the exceptions live.
Feels like the real unlock is letting each customer shape the AI to how they work. A Context Brain per customer, models trained on their own data where volume justifies it, letting their ops teams build their own agents and apps on the platform etc.
Curious if you're seeing actual pull for this from customers yet, or is it still vendors wanting it more than buyers?